MassCEC Clean Energy Industry Report
Services Provided: Layout Design, Data Visualization, Website Design, Website Development, Social Media Graphics
Introduction
Massachusetts Clean Energy Center (MassCEC) is a state economic development agency dedicated to fostering the growth of the clean energy sector in Massachusetts. The annual industry report is a key tool for communicating progress, achievements, and future plans to a wide range of stakeholders, including policymakers, industry leaders, and the general public. This project encompassed creating a professional print version and an interactive web version.
Project Objectives
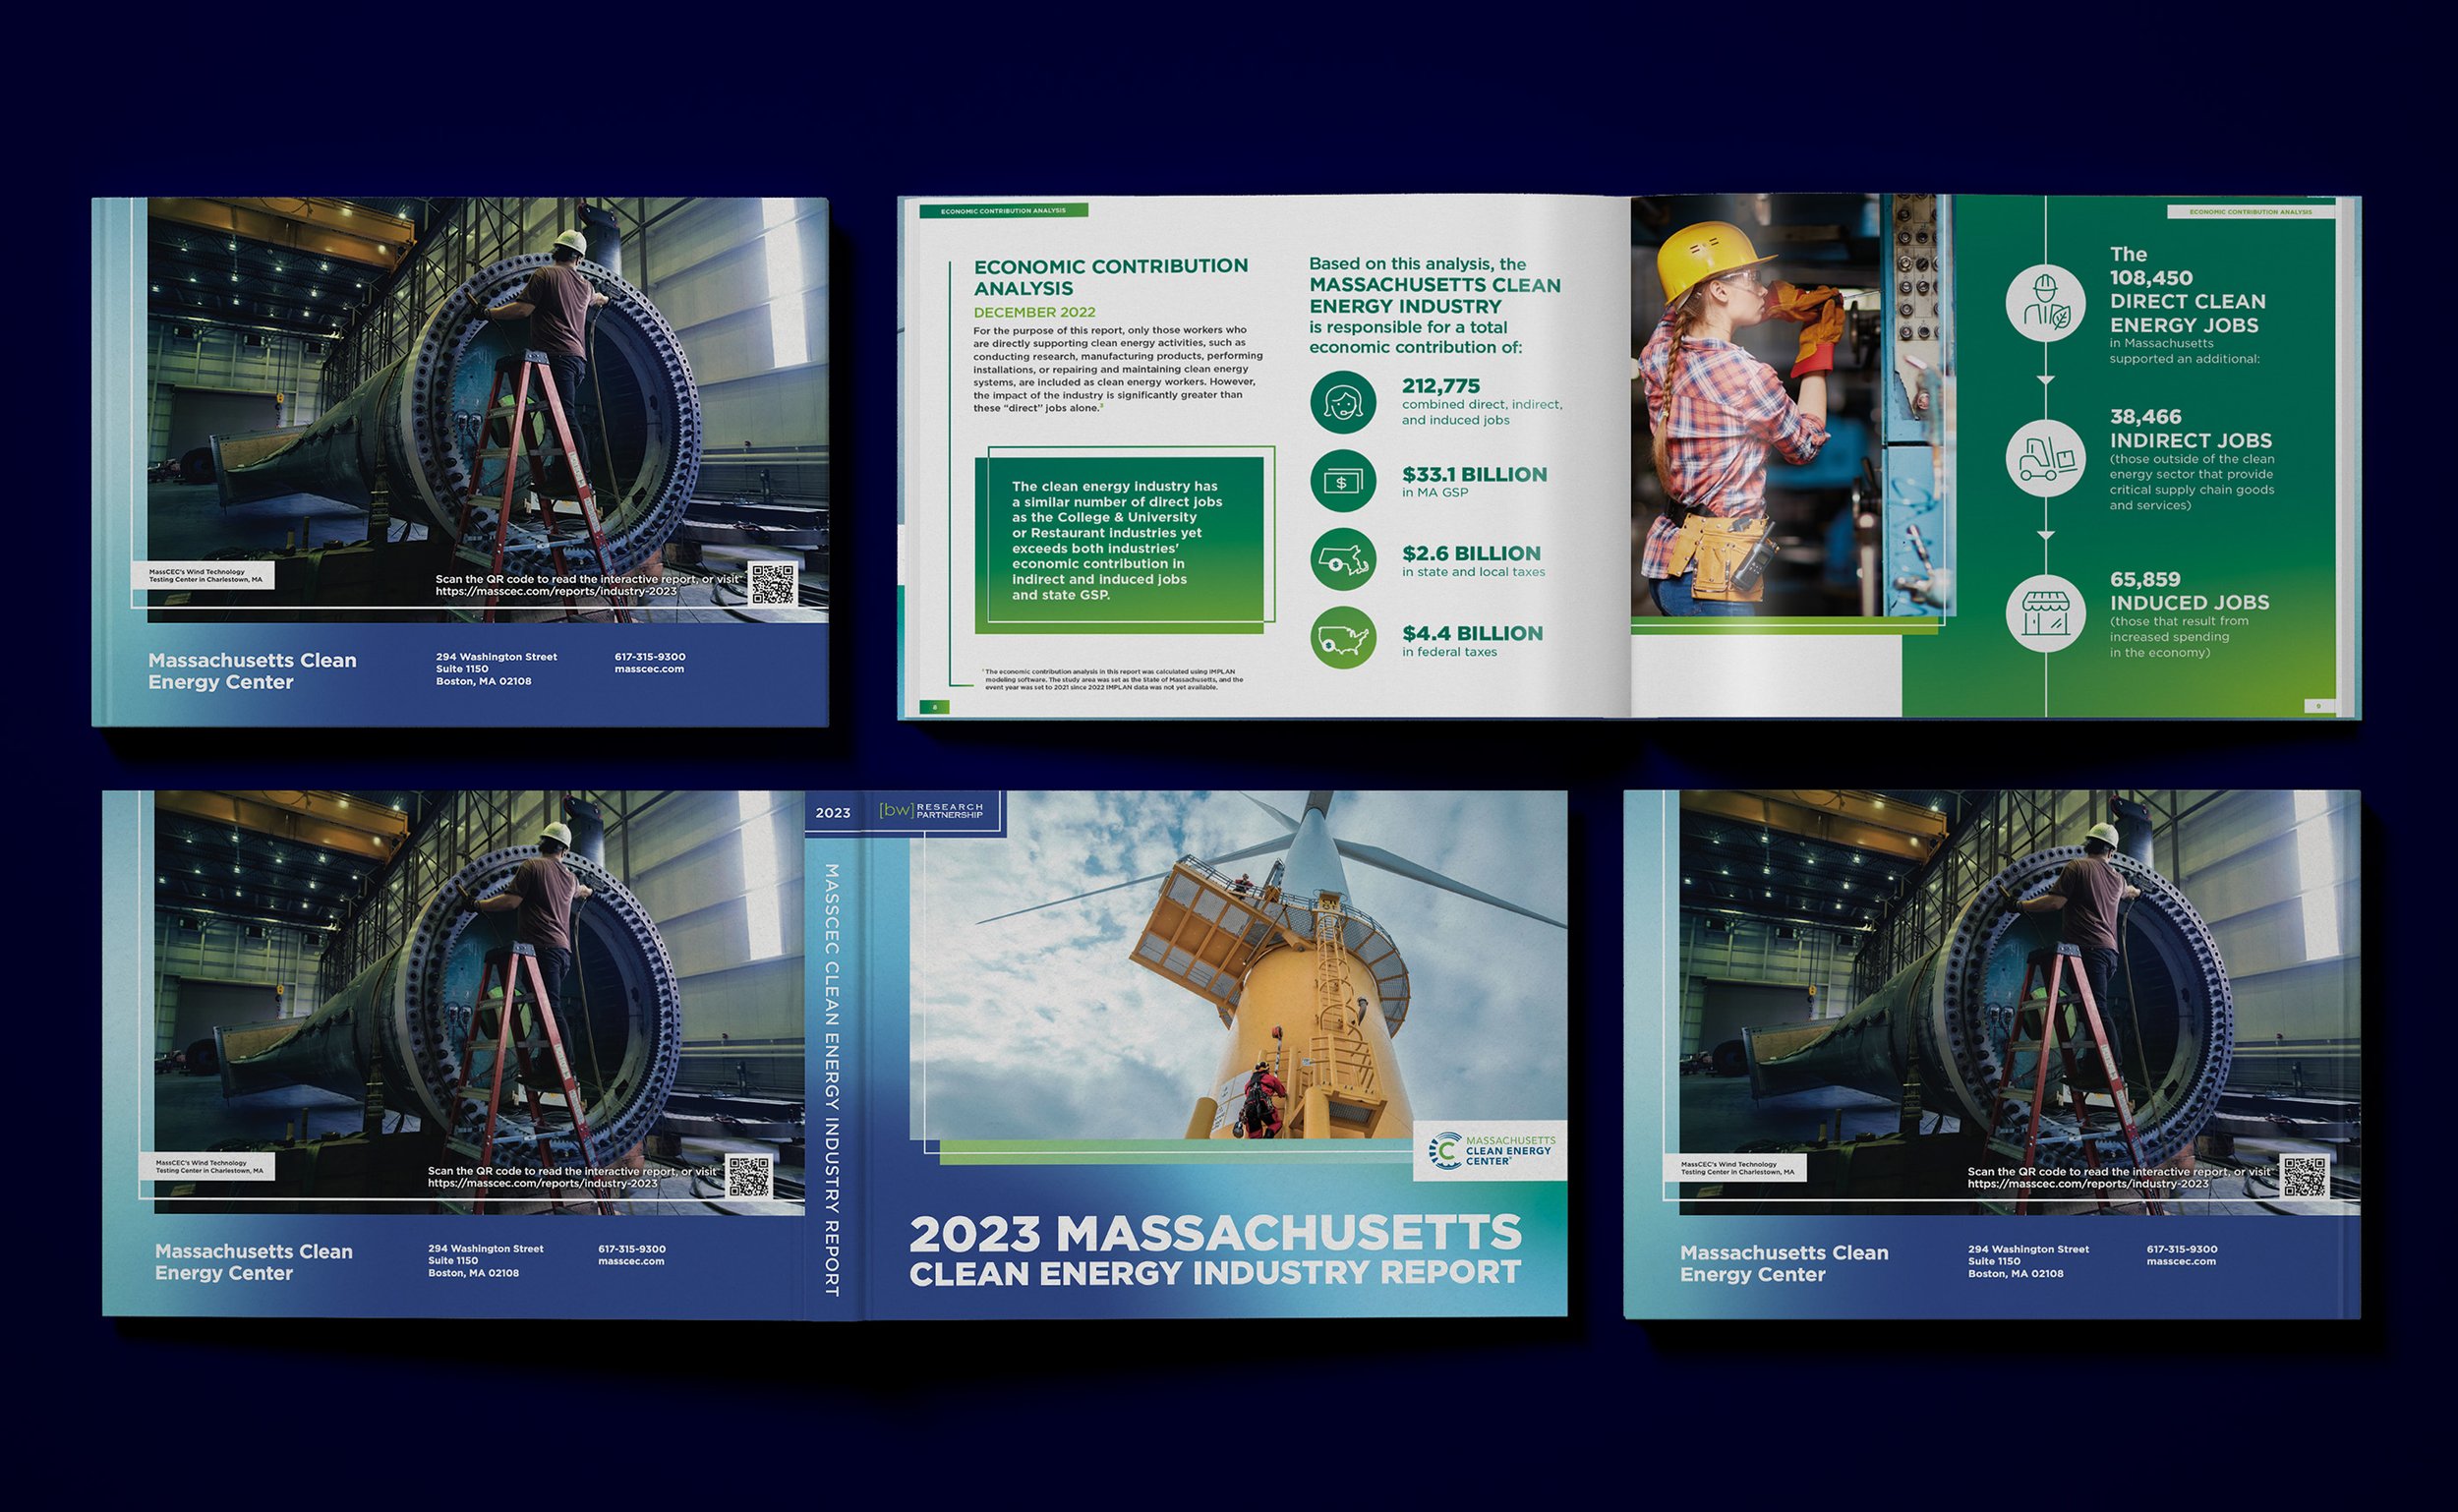
Design a Professional Printed Report:
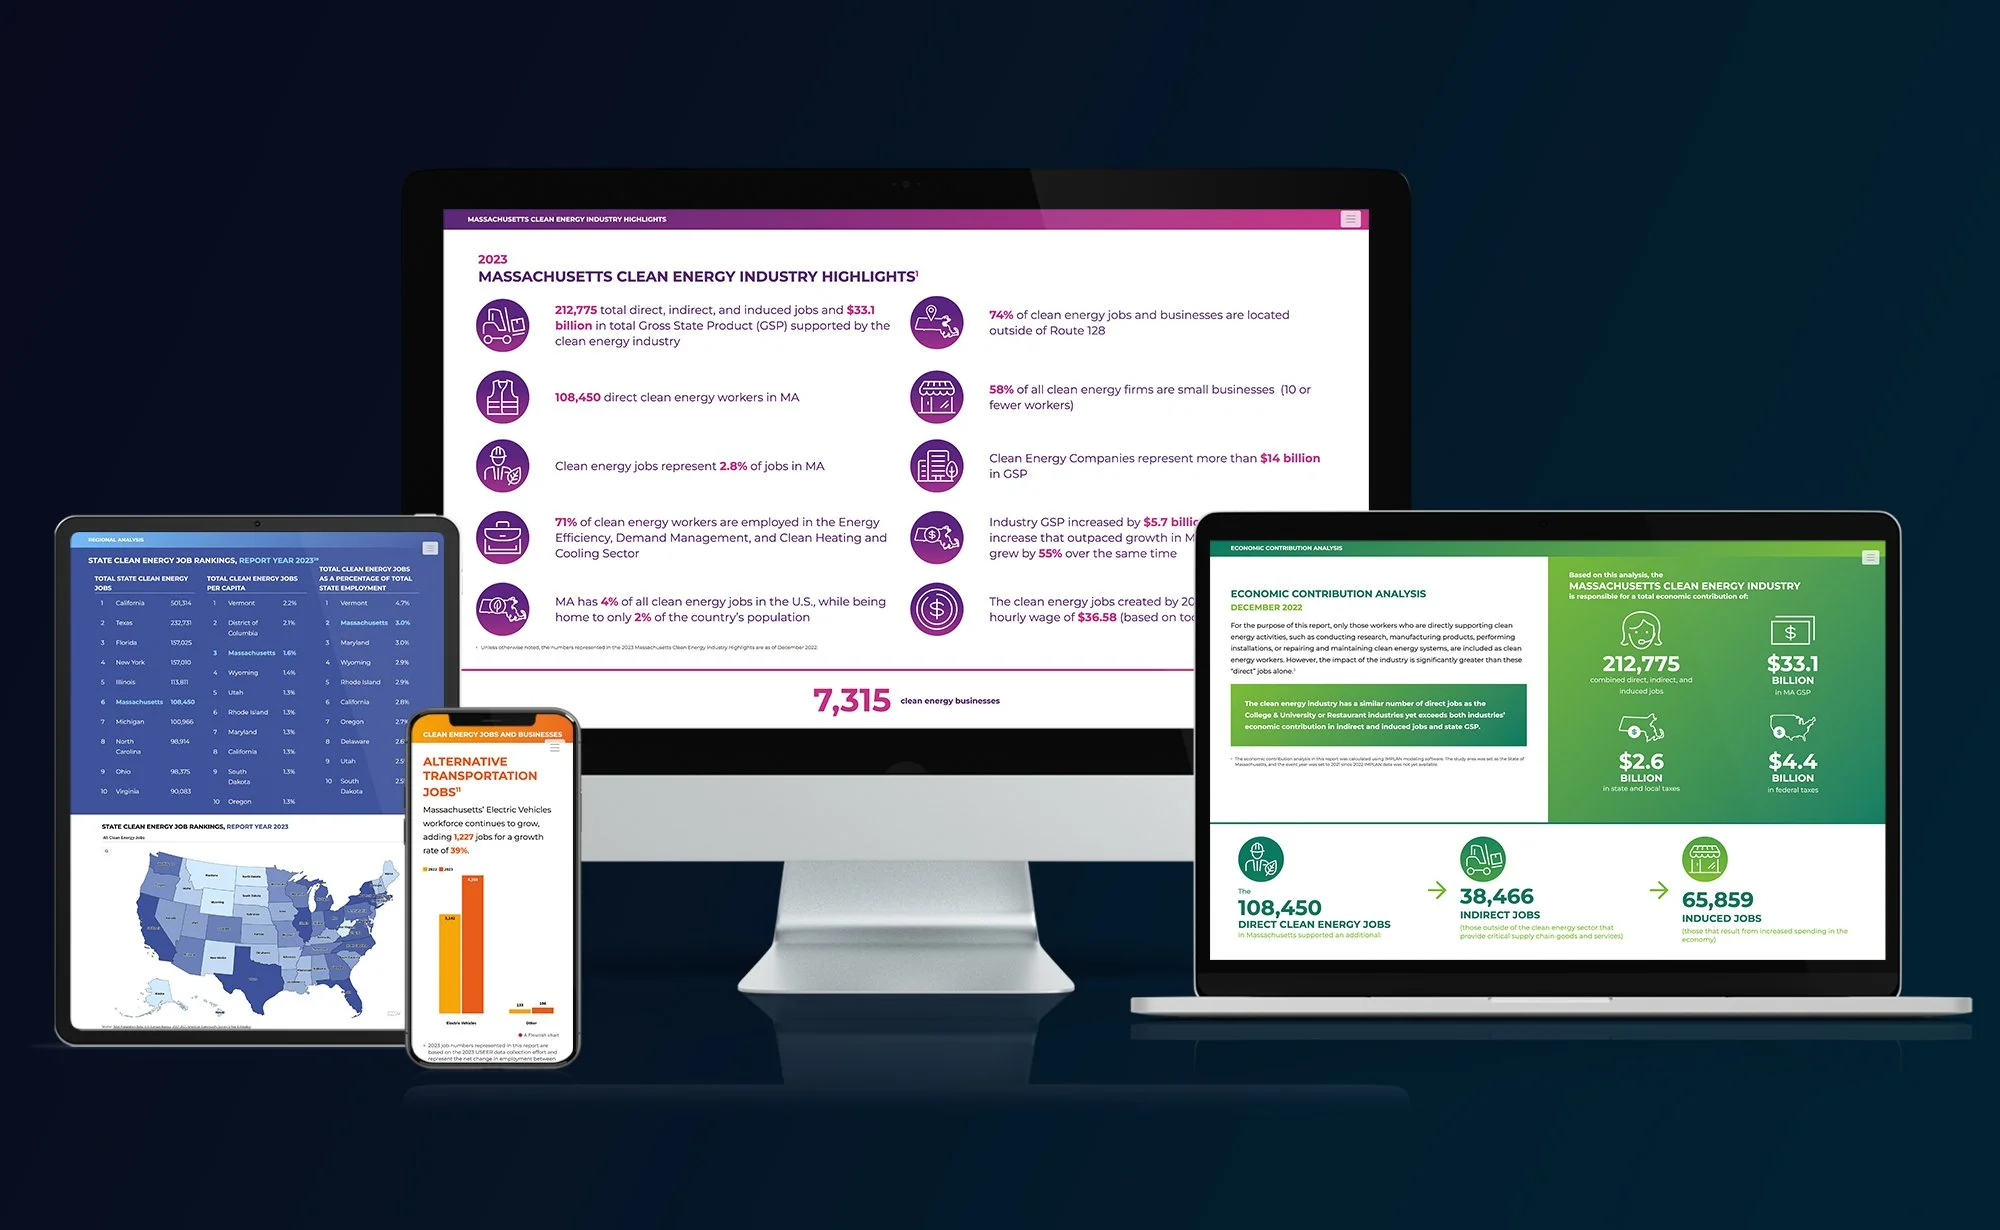
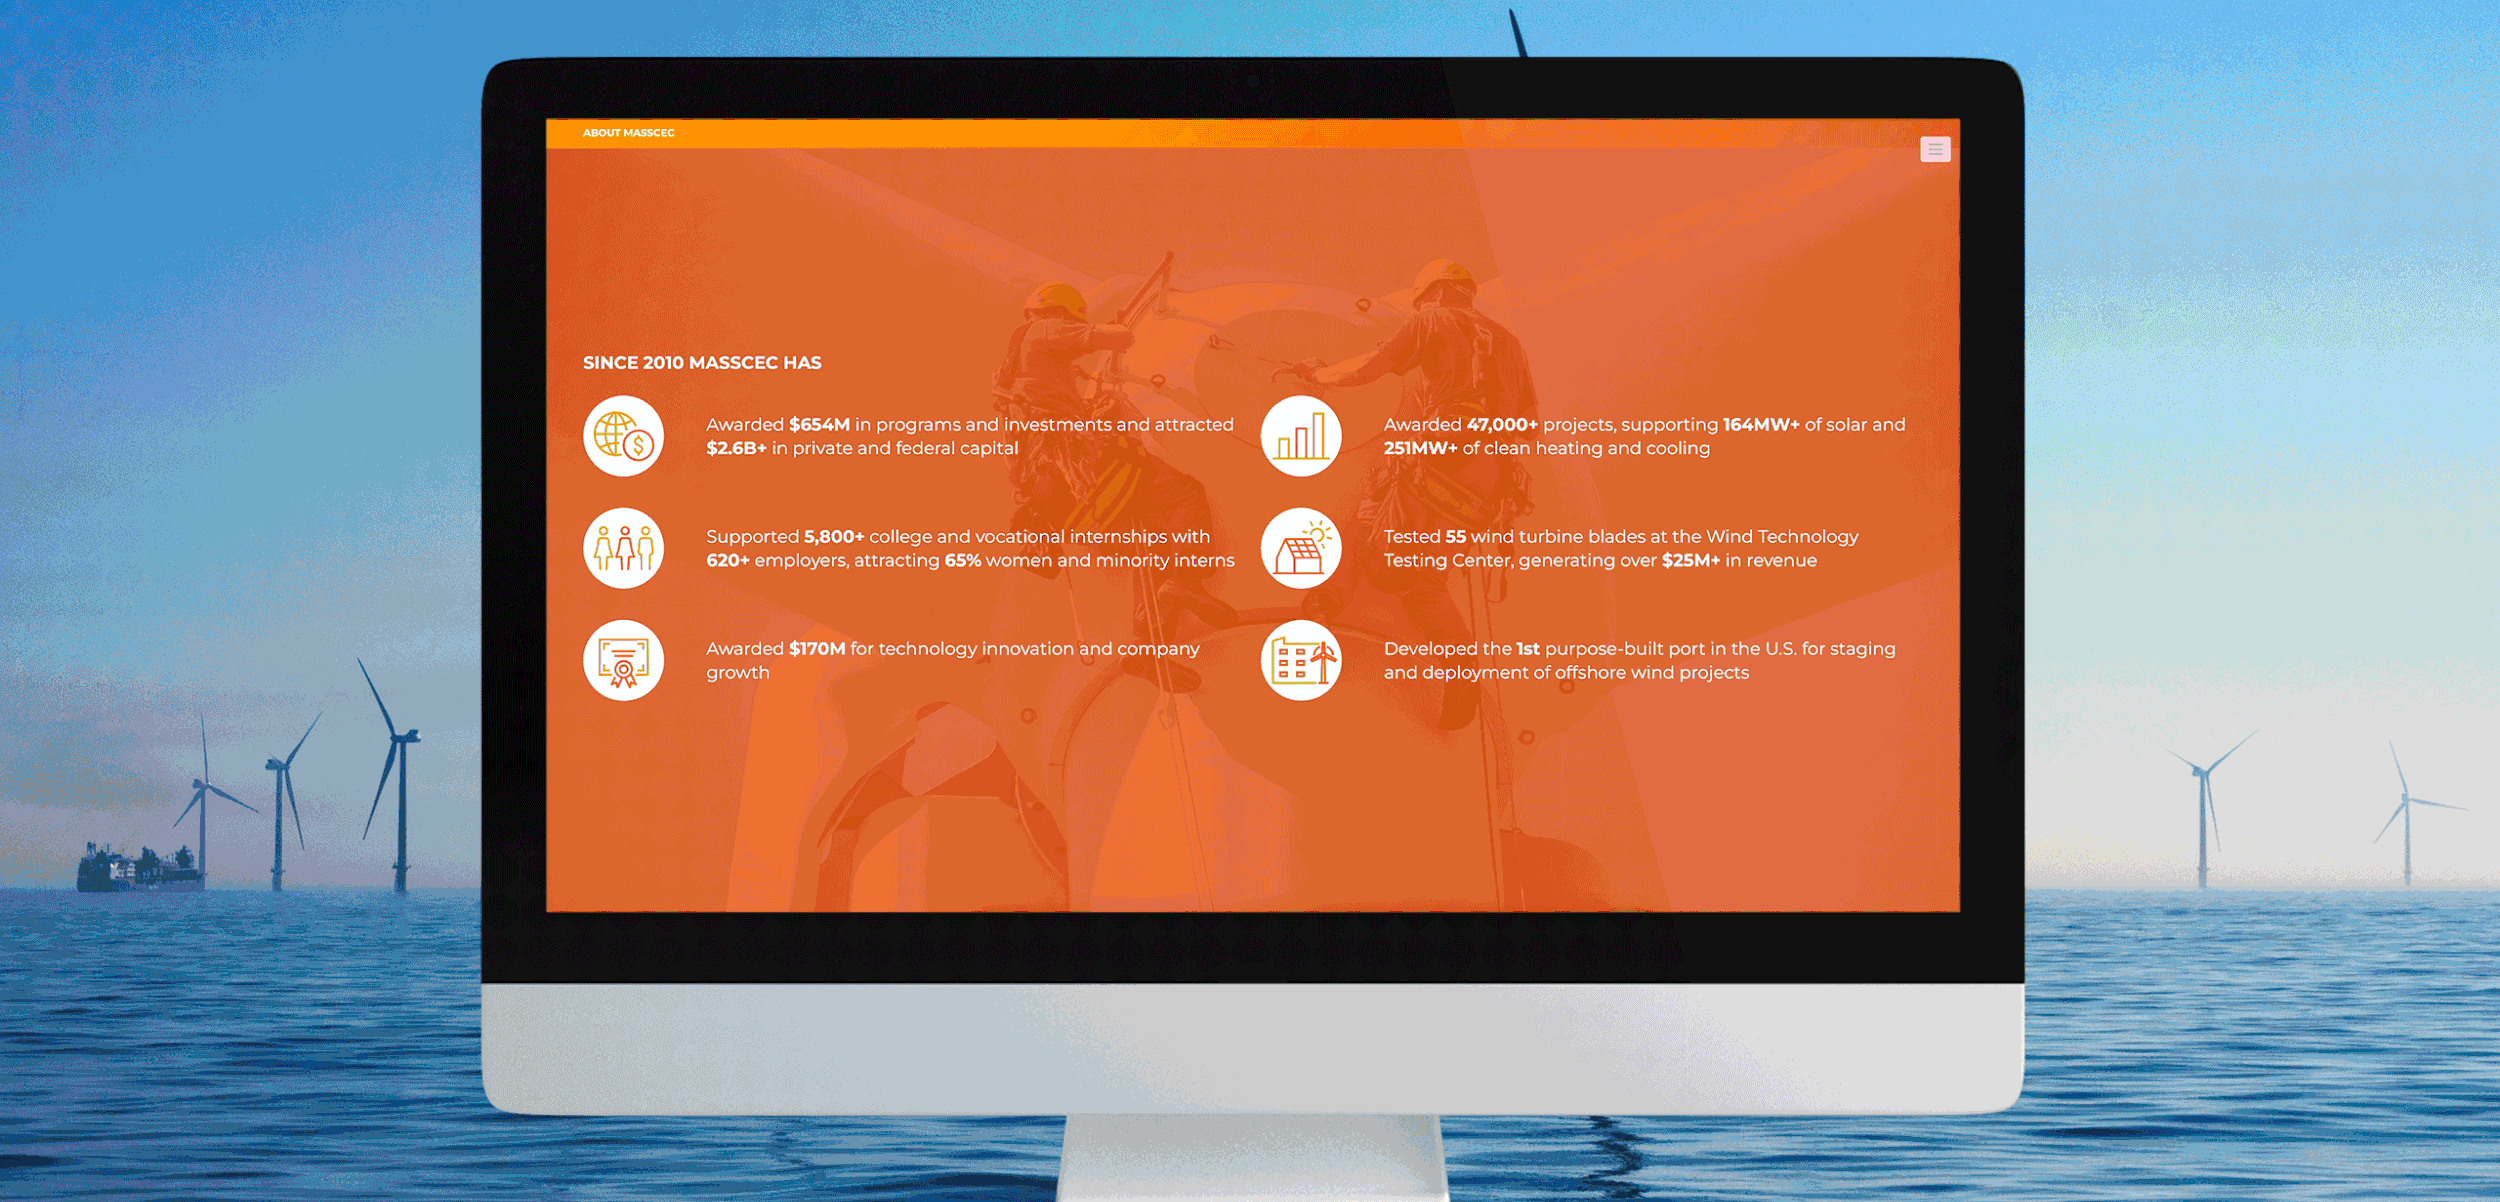
Develop an Interactive Web Version:
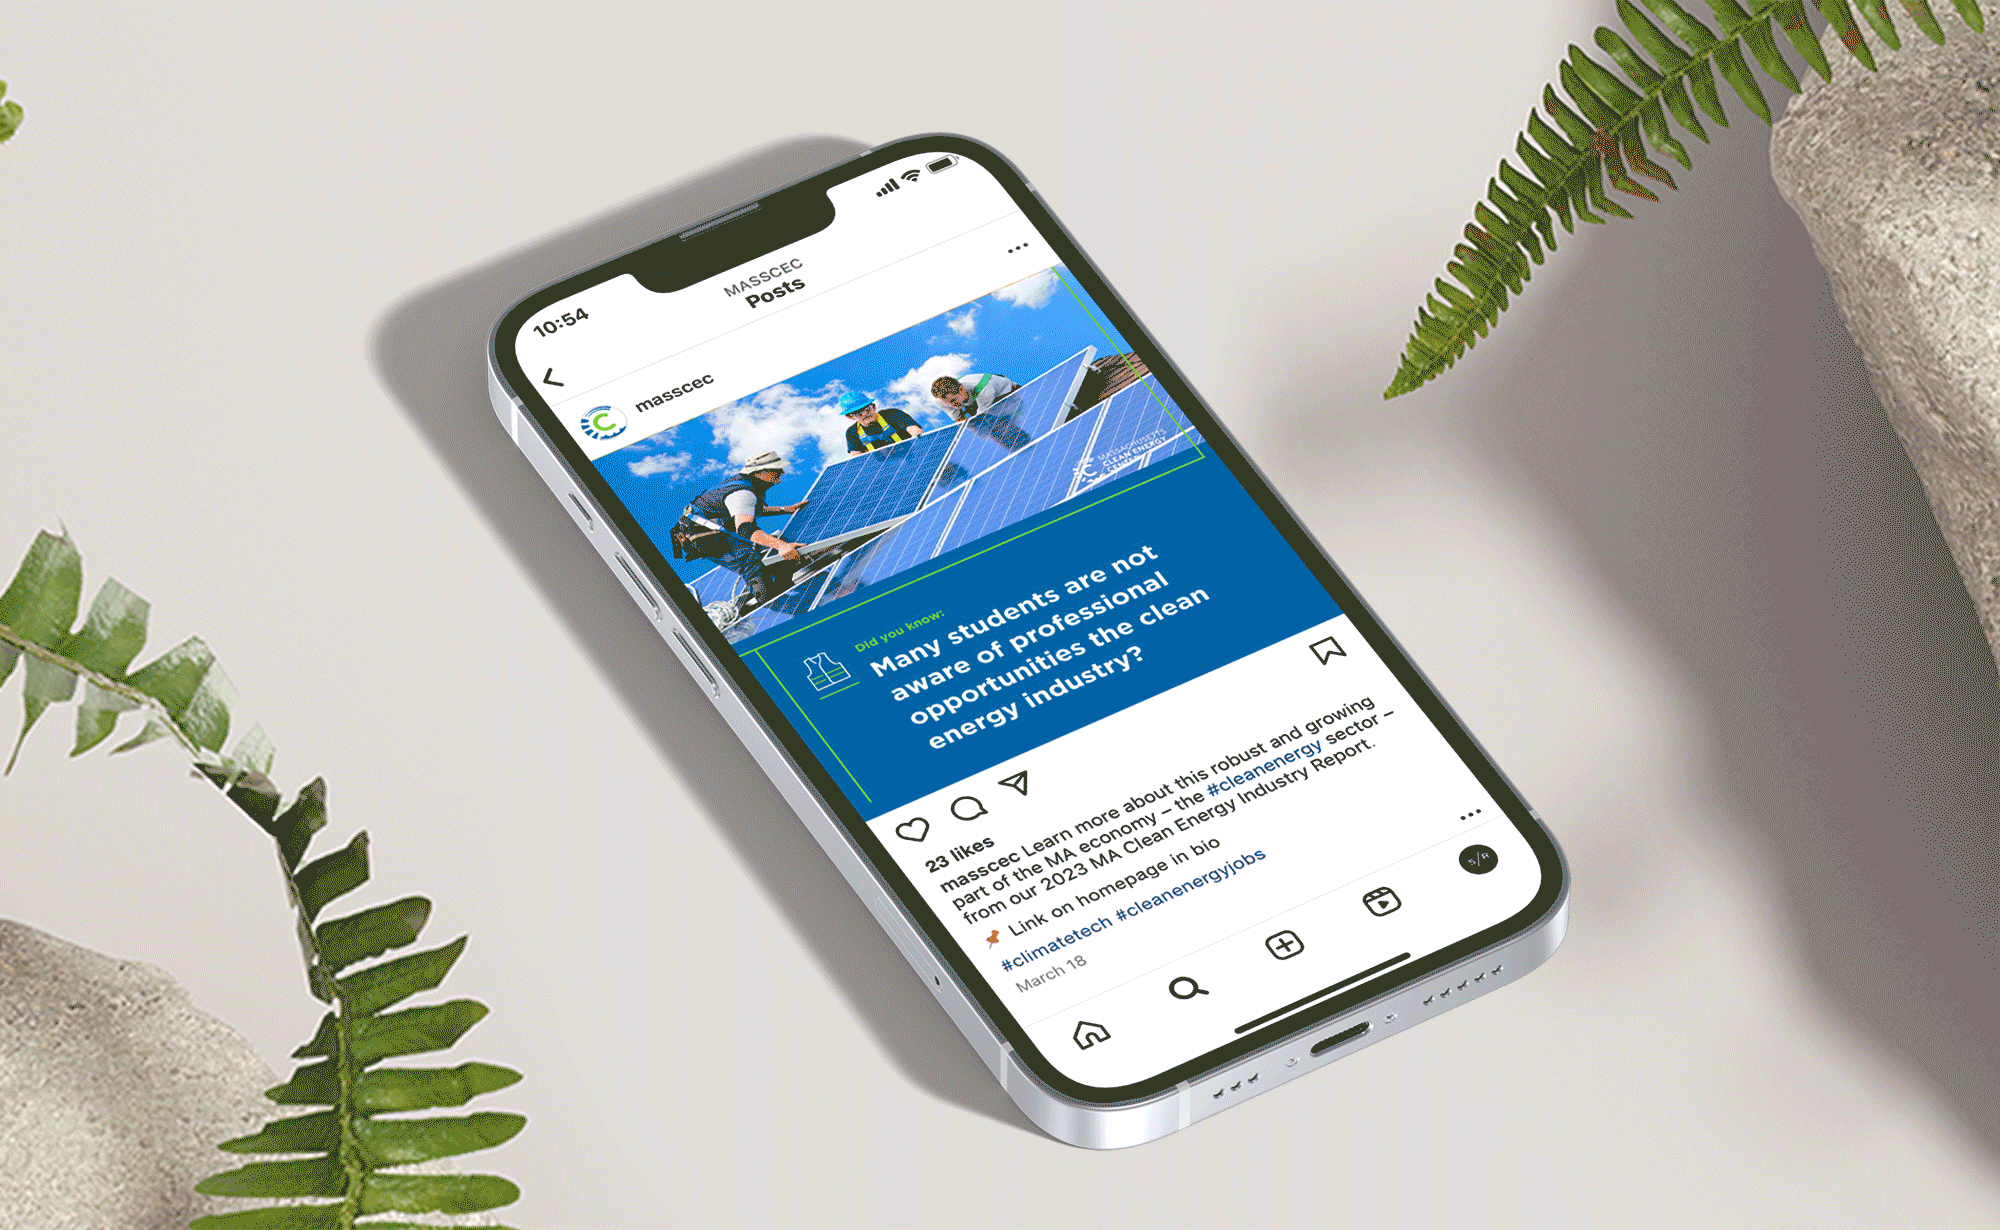
Develop Social Media Graphics
Website Design
WordPress Setup: Built a custom WordPress theme to replicate the print design while ensuring it was responsive and user-friendly.
Interactive Features: Integrated dynamic charts and tables using Flourish Charts. Features included clickable charts, filterable data tables, and expandable data sections.
User Experience (UX): Focused on creating an intuitive navigation system and ensuring a seamless user experience across various devices.
Accessibility and Performance: Ensured the web version was accessible and optimized for performance across different platforms.
Design and Layout for Print:
Concept Development: Created design concepts and mood boards that aligned with MassCEC’s branding and the report’s goals.
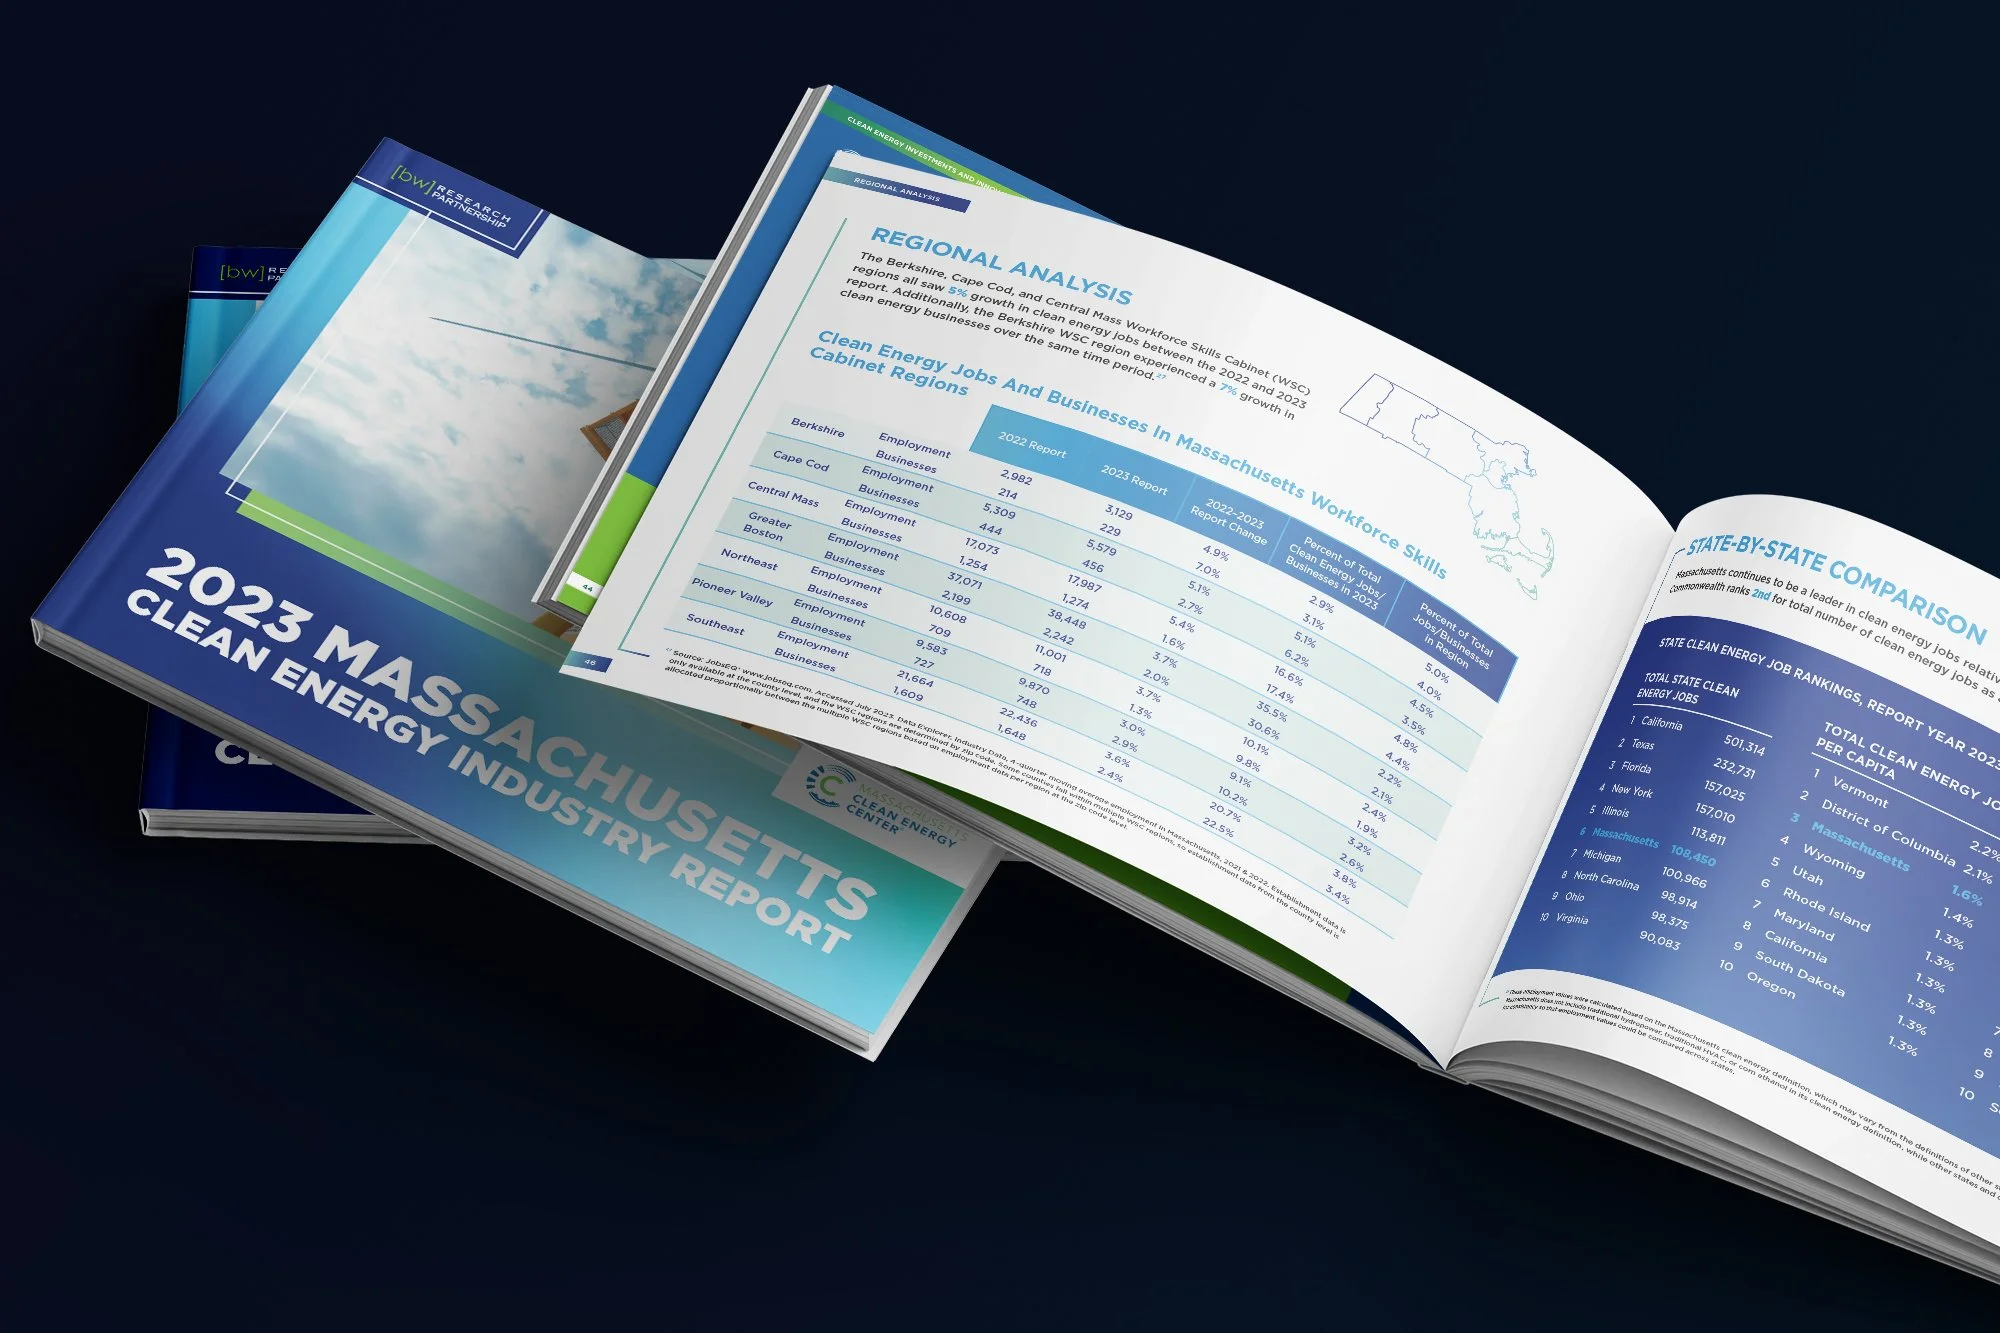
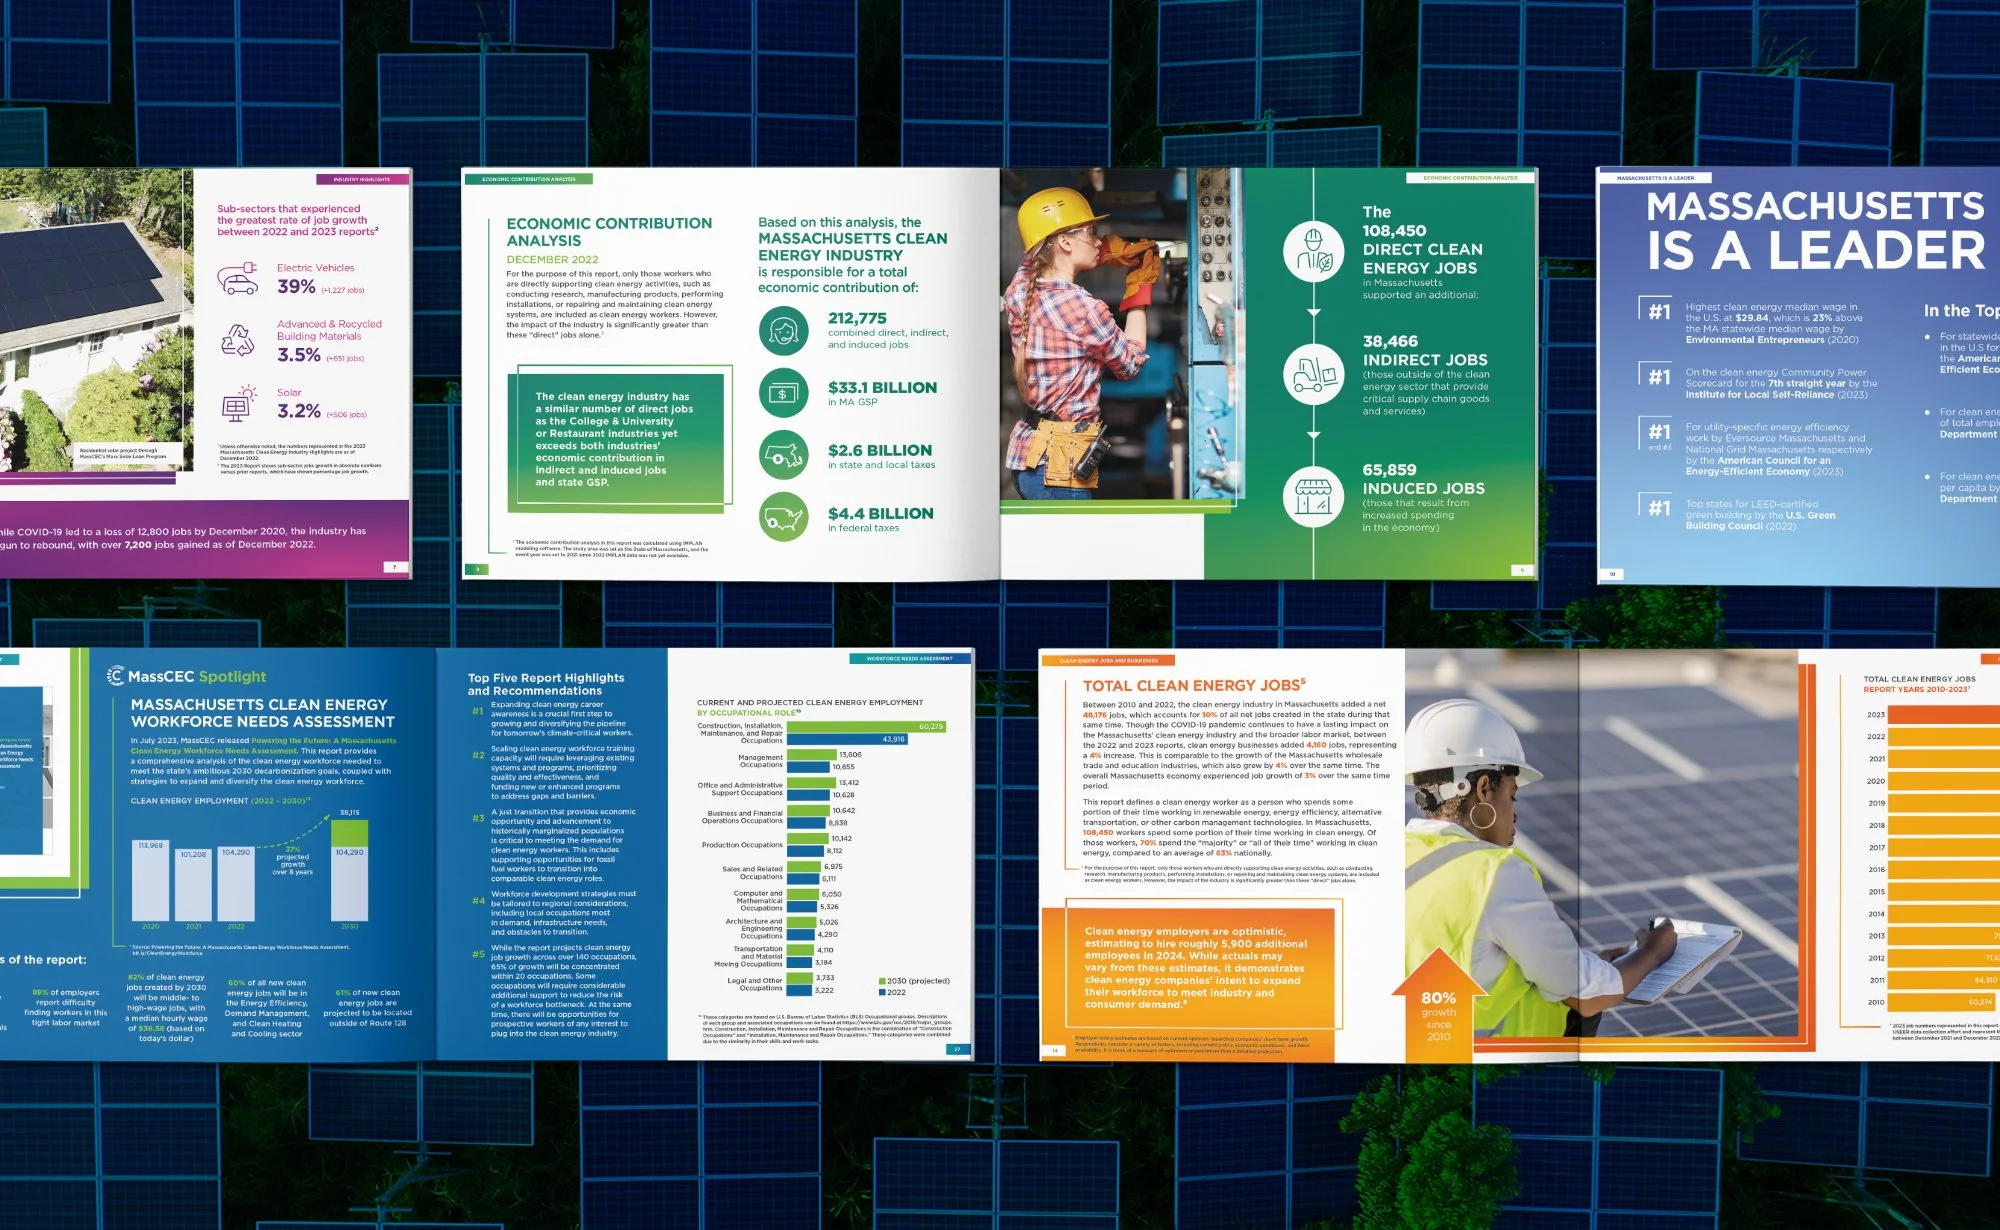
Layout Design: Developed a clean, structured layout including a cover page, table of contents, section headers, and data visualizations. Used consistent typography, color schemes, and imagery to enhance readability and engagement.
Data Visualization: Designed static charts, graphs, and infographics to effectively present complex data.
Social Media Graphics Development:
Graphic Design: Created a range of social media graphics including infographics, promotional banners, and data highlights to promote the report. Designed graphics to be visually appealing and aligned with the report’s branding.
Consistency and Branding: Ensured that all social media graphics maintained visual consistency with the printed and web versions of the report.